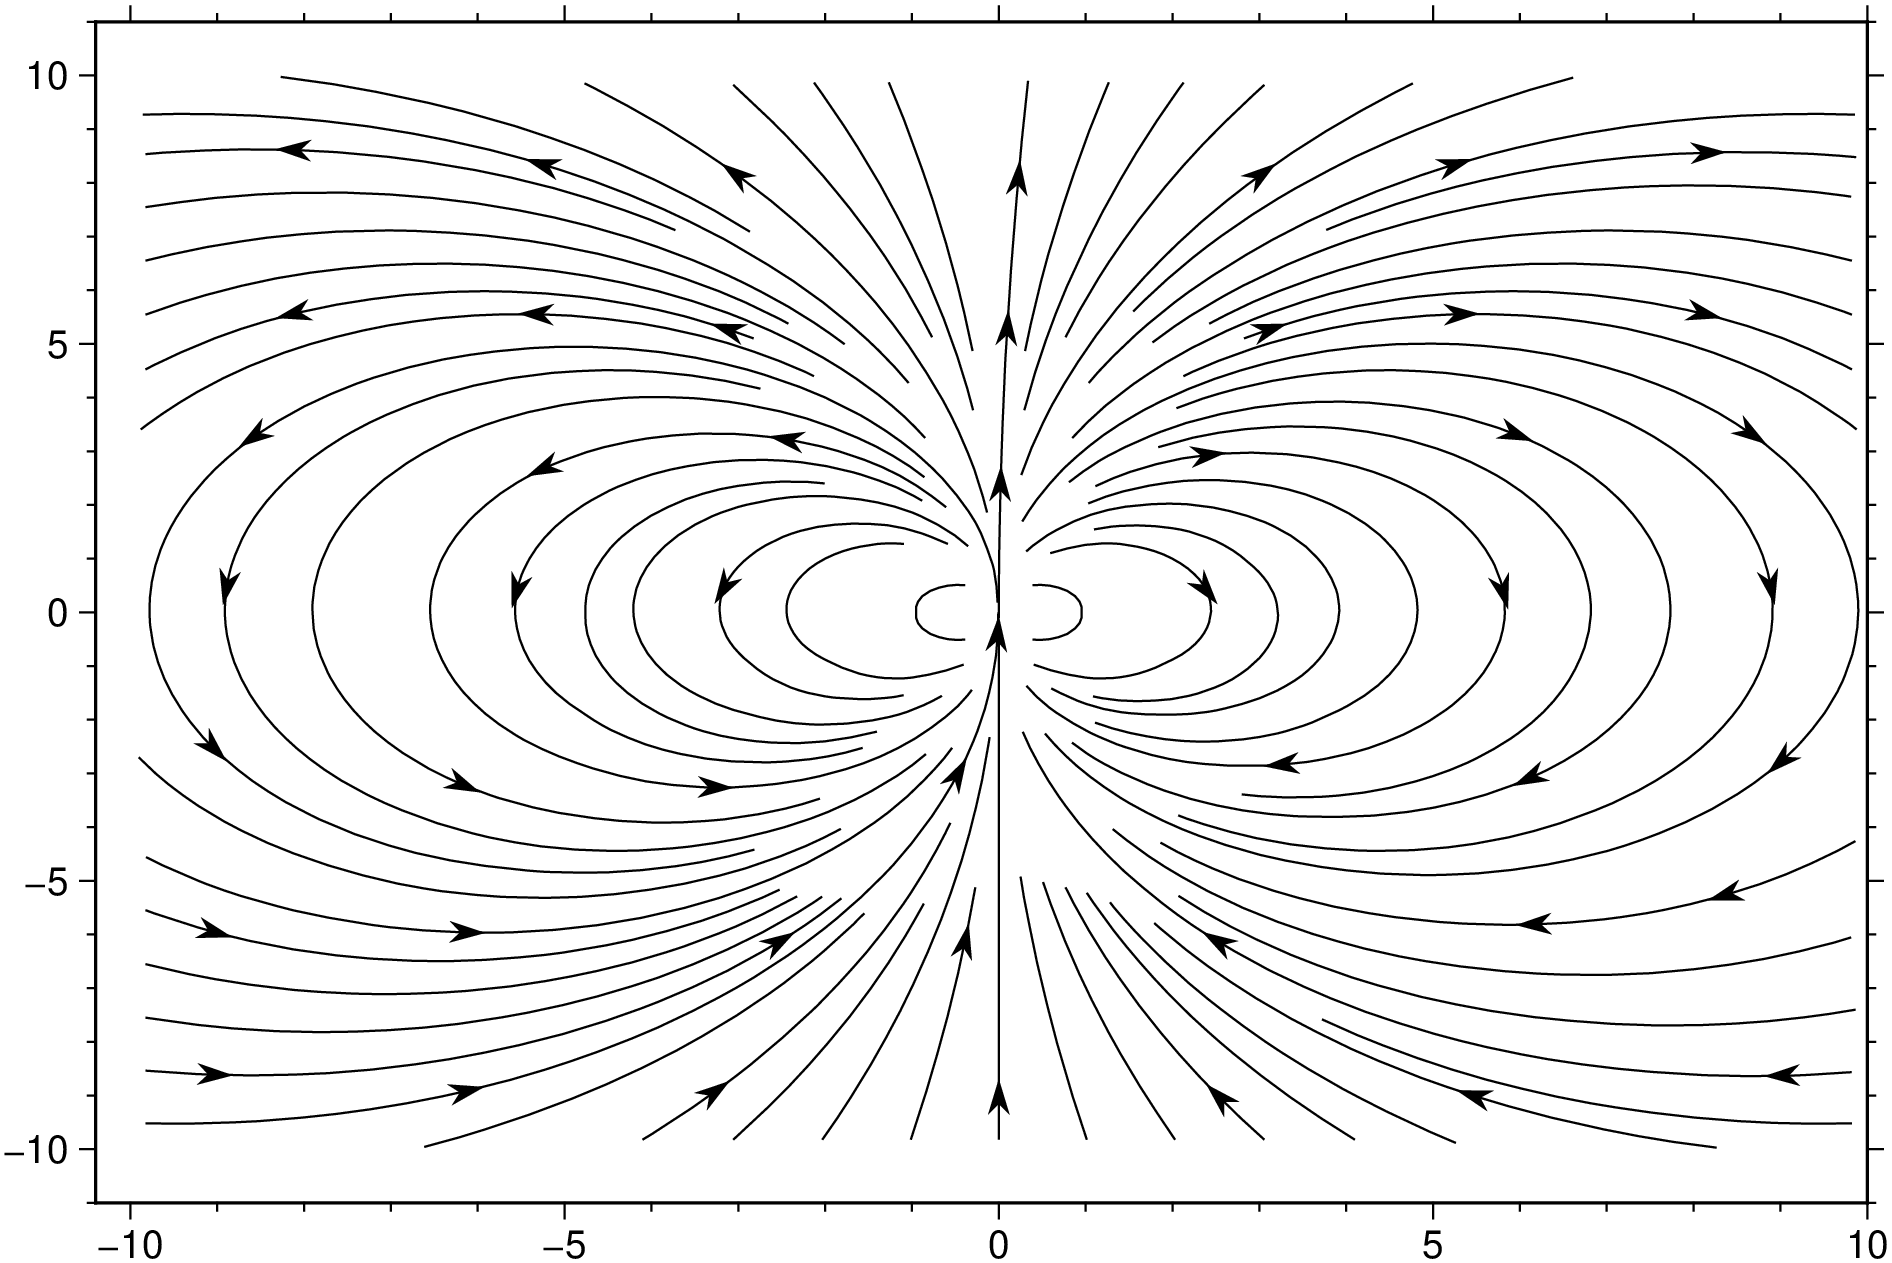
streamlines
S = streamlines(U::GMTgrid, V::GMTgrid, startX, startY; step=0.1, max_vert::Int=10000)Compute 2-D streamlines as a 2-D matrix (in fact, a GMTdataset) of vector fields. The inputs U and V are GMTgrids with the x and y velocity components, and startX and startY are the starting positions of the streamlines. step is the step size in data units for interpolating the vector data and max_vert is the maximum number of vertices in a streamline. startX and startY can both be scalars, vectors or one a scalar and the other a vector. Returns a Vector{GMTdataset} with the streamlines.
S = streamlines(U::GMTgrid, V::GMTgrid, D::GMTdataset; step=0.1, max_vert::Int=10000)In this method the streamlines starting positions are fetch from the 2 columns of the D argument. Returns a Vector{GMTdataset} with the streamlines.
S, A = streamlines(U::GMTgrid, V::GMTgrid; step=0.1, max_vert::Int=10000)Method that computes automatically spaced streamlines from 2D grids U and V. Returns the streamlines in the S Vector{GMTdataset} and A holds the positions along the streamlines where to plot arrow-heads if wished.
S = streamlines(U::GMTgrid, V::GMTgrid; side::Union{String, Symbol}="left", step=0.1, max_vert::Int=10000)Here we auto-generate the starting positions along one of the 4 sides of the grid. Select the wished side with the side keyword. Returns a Vector{GMTdataset} with the streamlines.
S = streamlines(x, y, U::Matrix, V::Matrix, sx, sy; step=0.1, max_vert::Int=10000)This last 2D method let users pass the x and y vector data coordinates, U and V are matrices with the velocity data and the remaining arguments have the same meaning as in the other methods. Returns a Vector{GMTdataset} with the streamlines.
S = streamlines(x::Matrix, y::Matrix, U::Matrix, V::Matrix; step=0.1, max_vert::Int=10000)x and y are assumed to be meshgrids with the x and y starting coordinates.
S = streamlines(U::GMTgrid, V::GMTgrid, W::GMTgrid, startX, startY, startZ; step=0.1, max_vert::Int=10000)Conpute 3D volume of vector fields with streamline. Here U,V and W are 3D cubes with x,y,z velocity components. startX, startY and startZ can be scalar or vector coordinate arrays. Returns a Vector{GMTdataset} with the streamlines.
Examples
using GMT

x,y = GMT.meshgrid(-10:10);
u = 2 .* x .* y;
v = y .^2 - x .^ 2;
U = mat2grid(u, x[1,:], y[:,1]);
V = mat2grid(v, x[1,:], y[:,1]);
r,a = streamlines(U, V);
plot(r, decorated=(locations=a, symbol=(custom="arrow", size=0.3), fill=:black, dec2=true), show=1)
See Also
These docs were autogenerated using GMT: v1.33.1
